How to find commonly-used metrics and reports in GA4
A one-stop guide for the key numbers

Written by Benji Weiser
Updated at March 26th, 2024


Table of Contents
Common Reports
This is a collection of the most common reports used by customers on Pugpig Bolt. This is designed to be a document you can keep handy and circulate with anybody For each report there will be instructions on how to create them, or if they are standard reports, how to find them within the interface.
The table of contents should provide an easy way to find the specific metrics you're looking for. We've included screenshots where necessary, as well as links out to Google's own documentation. As always, with any further questions on this please get in touch with us at support@pugpig.com
Standard Reports
Standard reports are those that are included by default in Google Analytics, an explanation of where to find them will be given if they are a common report.
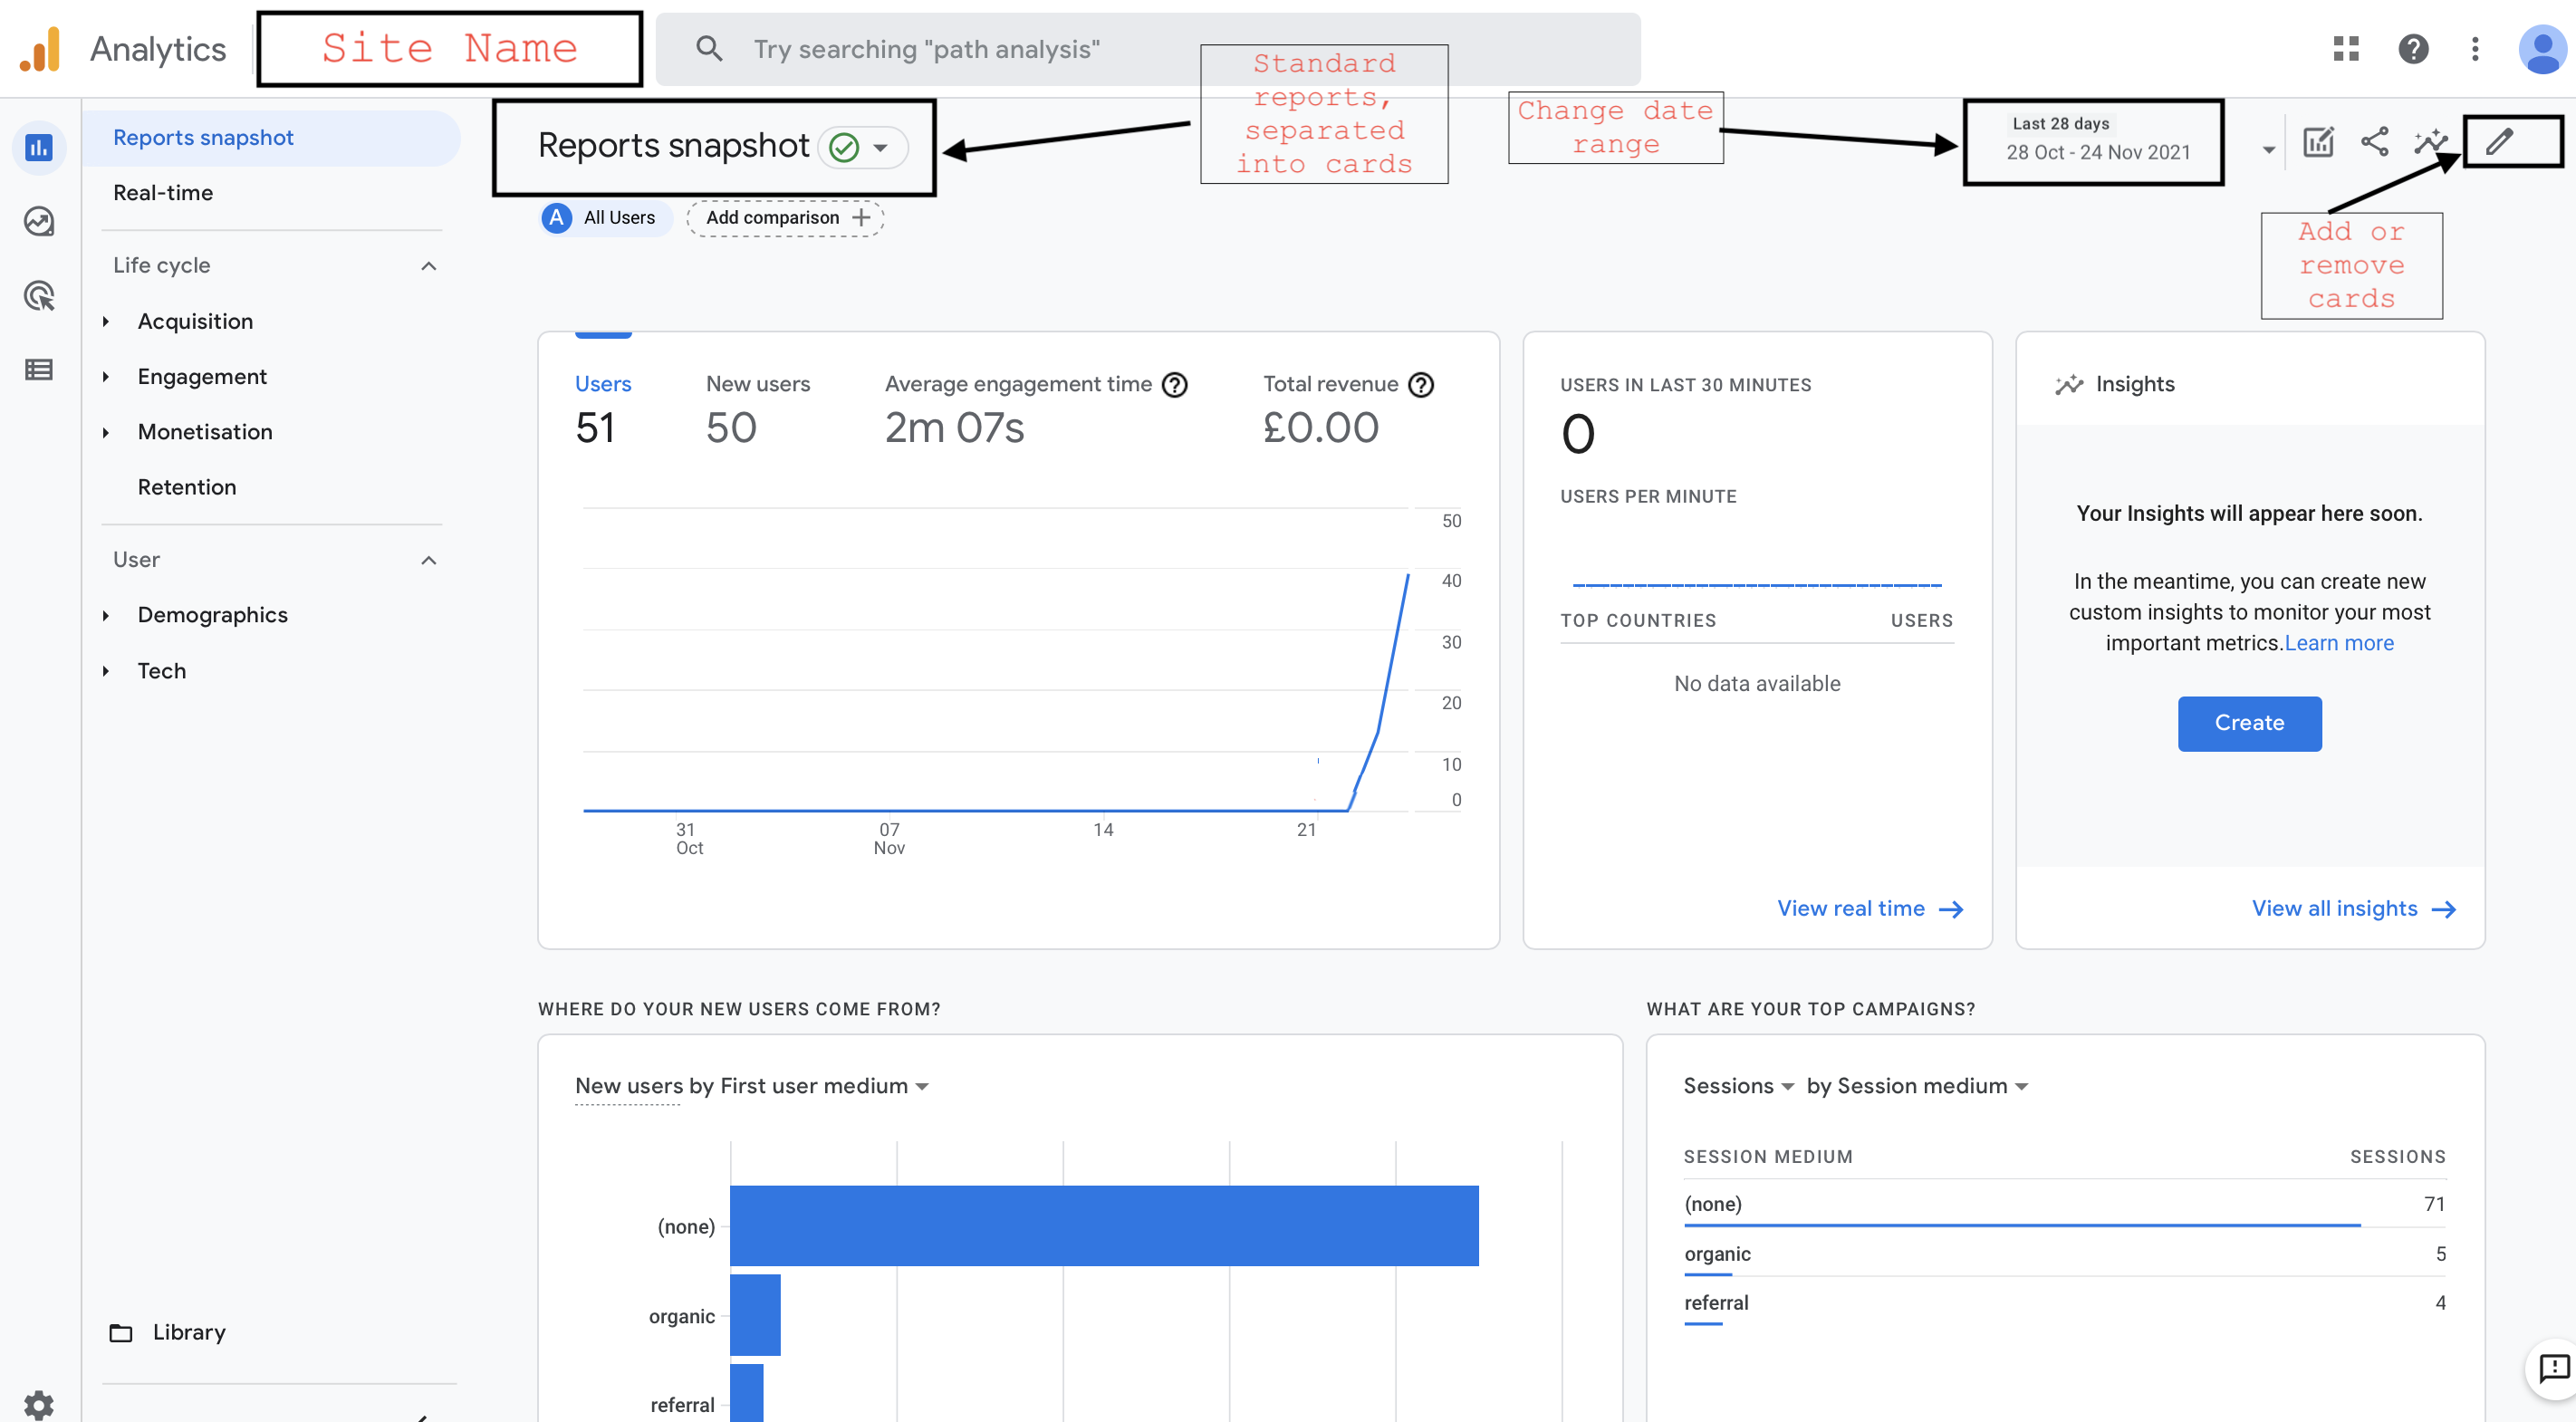
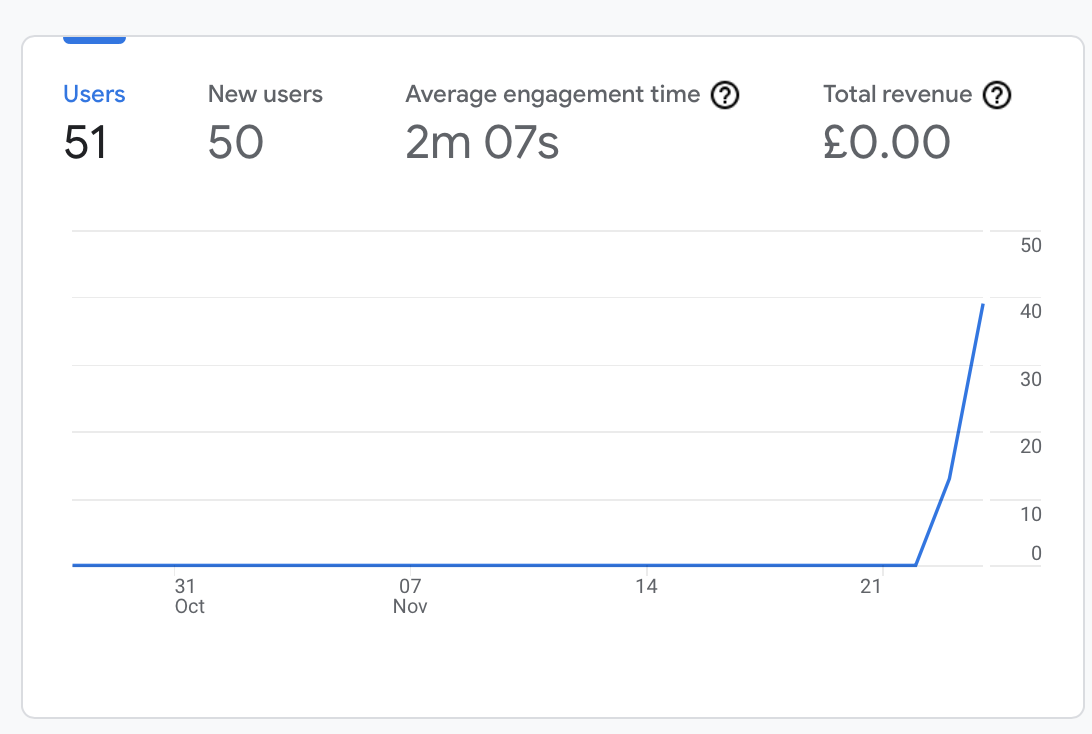
Google are continuously updating this interface which means some of the names can change but there shouldn't be much changing in terms of the actual data that is available. Below is the screenshot of the "Reports Snapshot" which is an overview of your site/app performance over the last 7 days and where much of the data you look at regularly sits.
Total users of your app
Read more about Googles' definitions about Users vs New Users
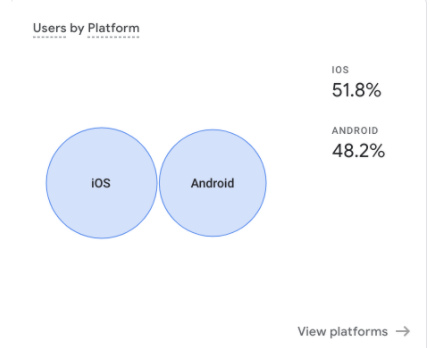
Users by Platform
This is viewable under Users > Tech > Tech overview. There are firebase-provided dimensions to allow you to apply this to different views, these are
- Device category
- Operating system
New Users
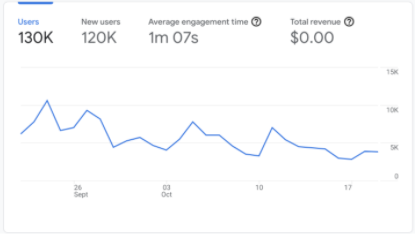
Total sessions
Google Analytics -> Reports Snapshot
Googles' session definition
Session duration and Screens per session
The level of engagement of your users is readily available in Engagement > Overview
Google Analytics / Reports Snapshot
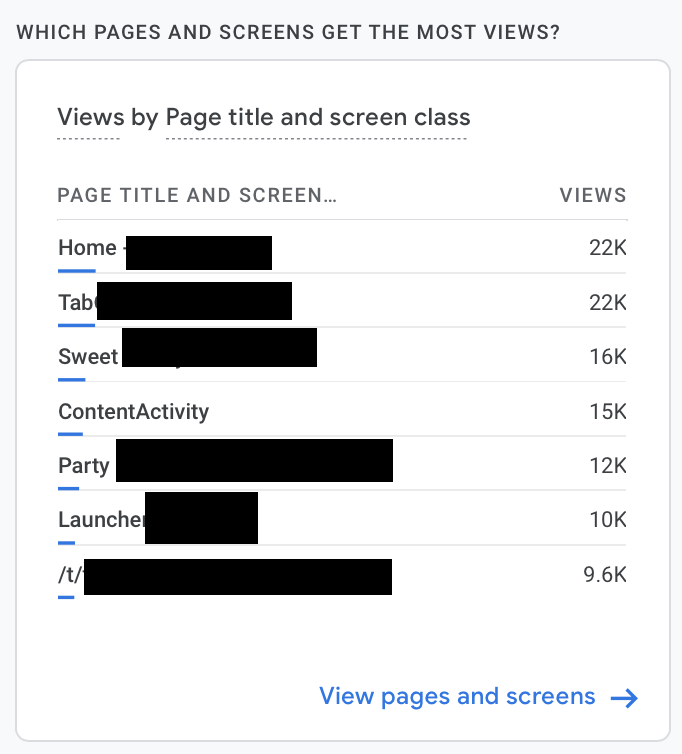
Total screen views
Google Analytics / Reports Snapshot
This section includes the card below which is a snapshot of the most popular pages and the number of views they have received. To see a total click on "view pages and screens" where you will see a total and more detail of this data.
Total subscribers/logged-in users
To segment your data by the type of subscriber use the custom dimension KGSubscriberStatus which – as of Bolt version 3.20 – is both a user- and event-scoped dimension. The values for this dimension are as follows:
| None | The user has not signed in or made any purchases |
| (not set) | No subscription status could be detected – often appears on automatically collected events |
| Existing Subscriber | A user has signed in via your authentication system |
| Inactive Subscriber | A user who is signed in via your authentication but does not have access, usually through their subscription expiring |
| iTunes/Google Play Subscriber | The user has purchased a subscription via in-app purchase |
| iTunes/Google Play Single Issue Purchase | The user has purchases one or more issues via in-app purchase |
Note: the very first automatically collected GA4 event that fires will not have any Pugpig custom dimensions assigned to it and therefore all users will at some point record a '(not set)' value against the KGSubscriberStatus dimension.
Due to the fact that a user can move between subscriber states users may be counted towards multiple subscriber statuses during your reporting period, even when using the user-scoped dimension. For example when an iOS user arrives at the app for the very first time, their first subscriber status is '(not set)', their subsequent subscriber status will be 'None' until they take out an in-app subscription at which point their subscriber status changes to 'iTunesSubscriber'.
To circumvent this you can you can create audience segments to identify users' current subscriber status.
You'll need to build a user segment for each subscriber status value. When selecting the conditions for your user segment, choose the user-scoped KGSubscriberStatus from the list of custom dimensions
 Select the user-scoped KGSubscriberStatus dimension as the basis of your user segment
Ensure you untick the 'At any point in time' box to only include users who currently have the specified subscriber status.
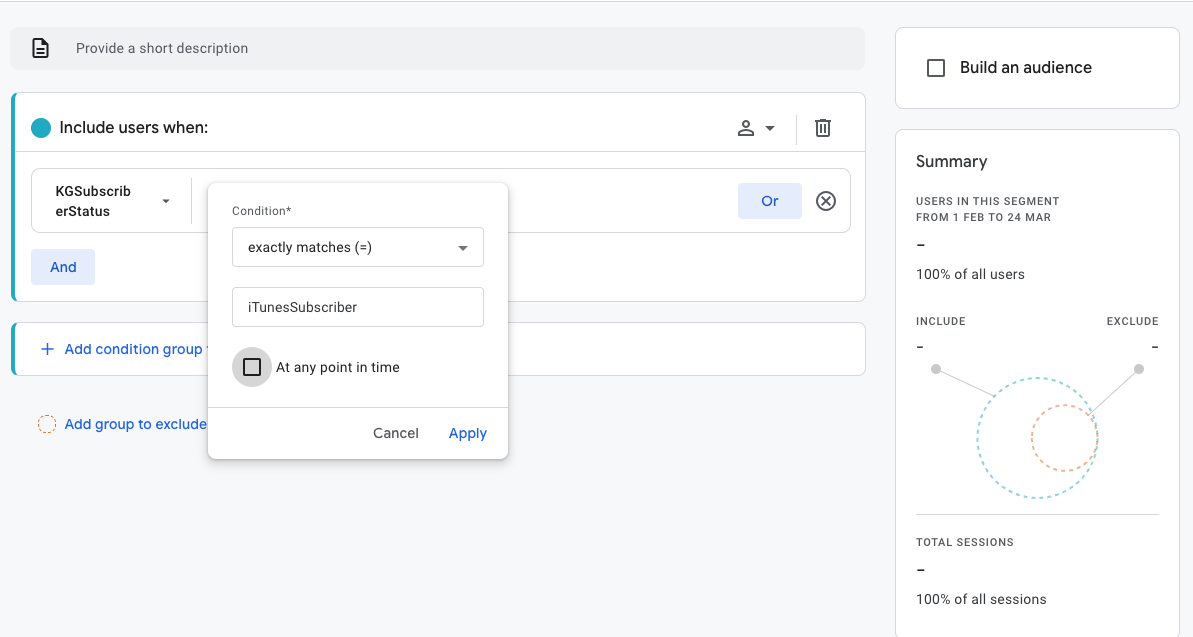 Creating a user segment that only contains users who currently have a subscriber status value of iTunesSubscriber
You'll need to repeat this for each subscriber status that applies to your users. You can create an audience from these segments by ticking the 'Build an audience' box in the top right corner of the segment creator.
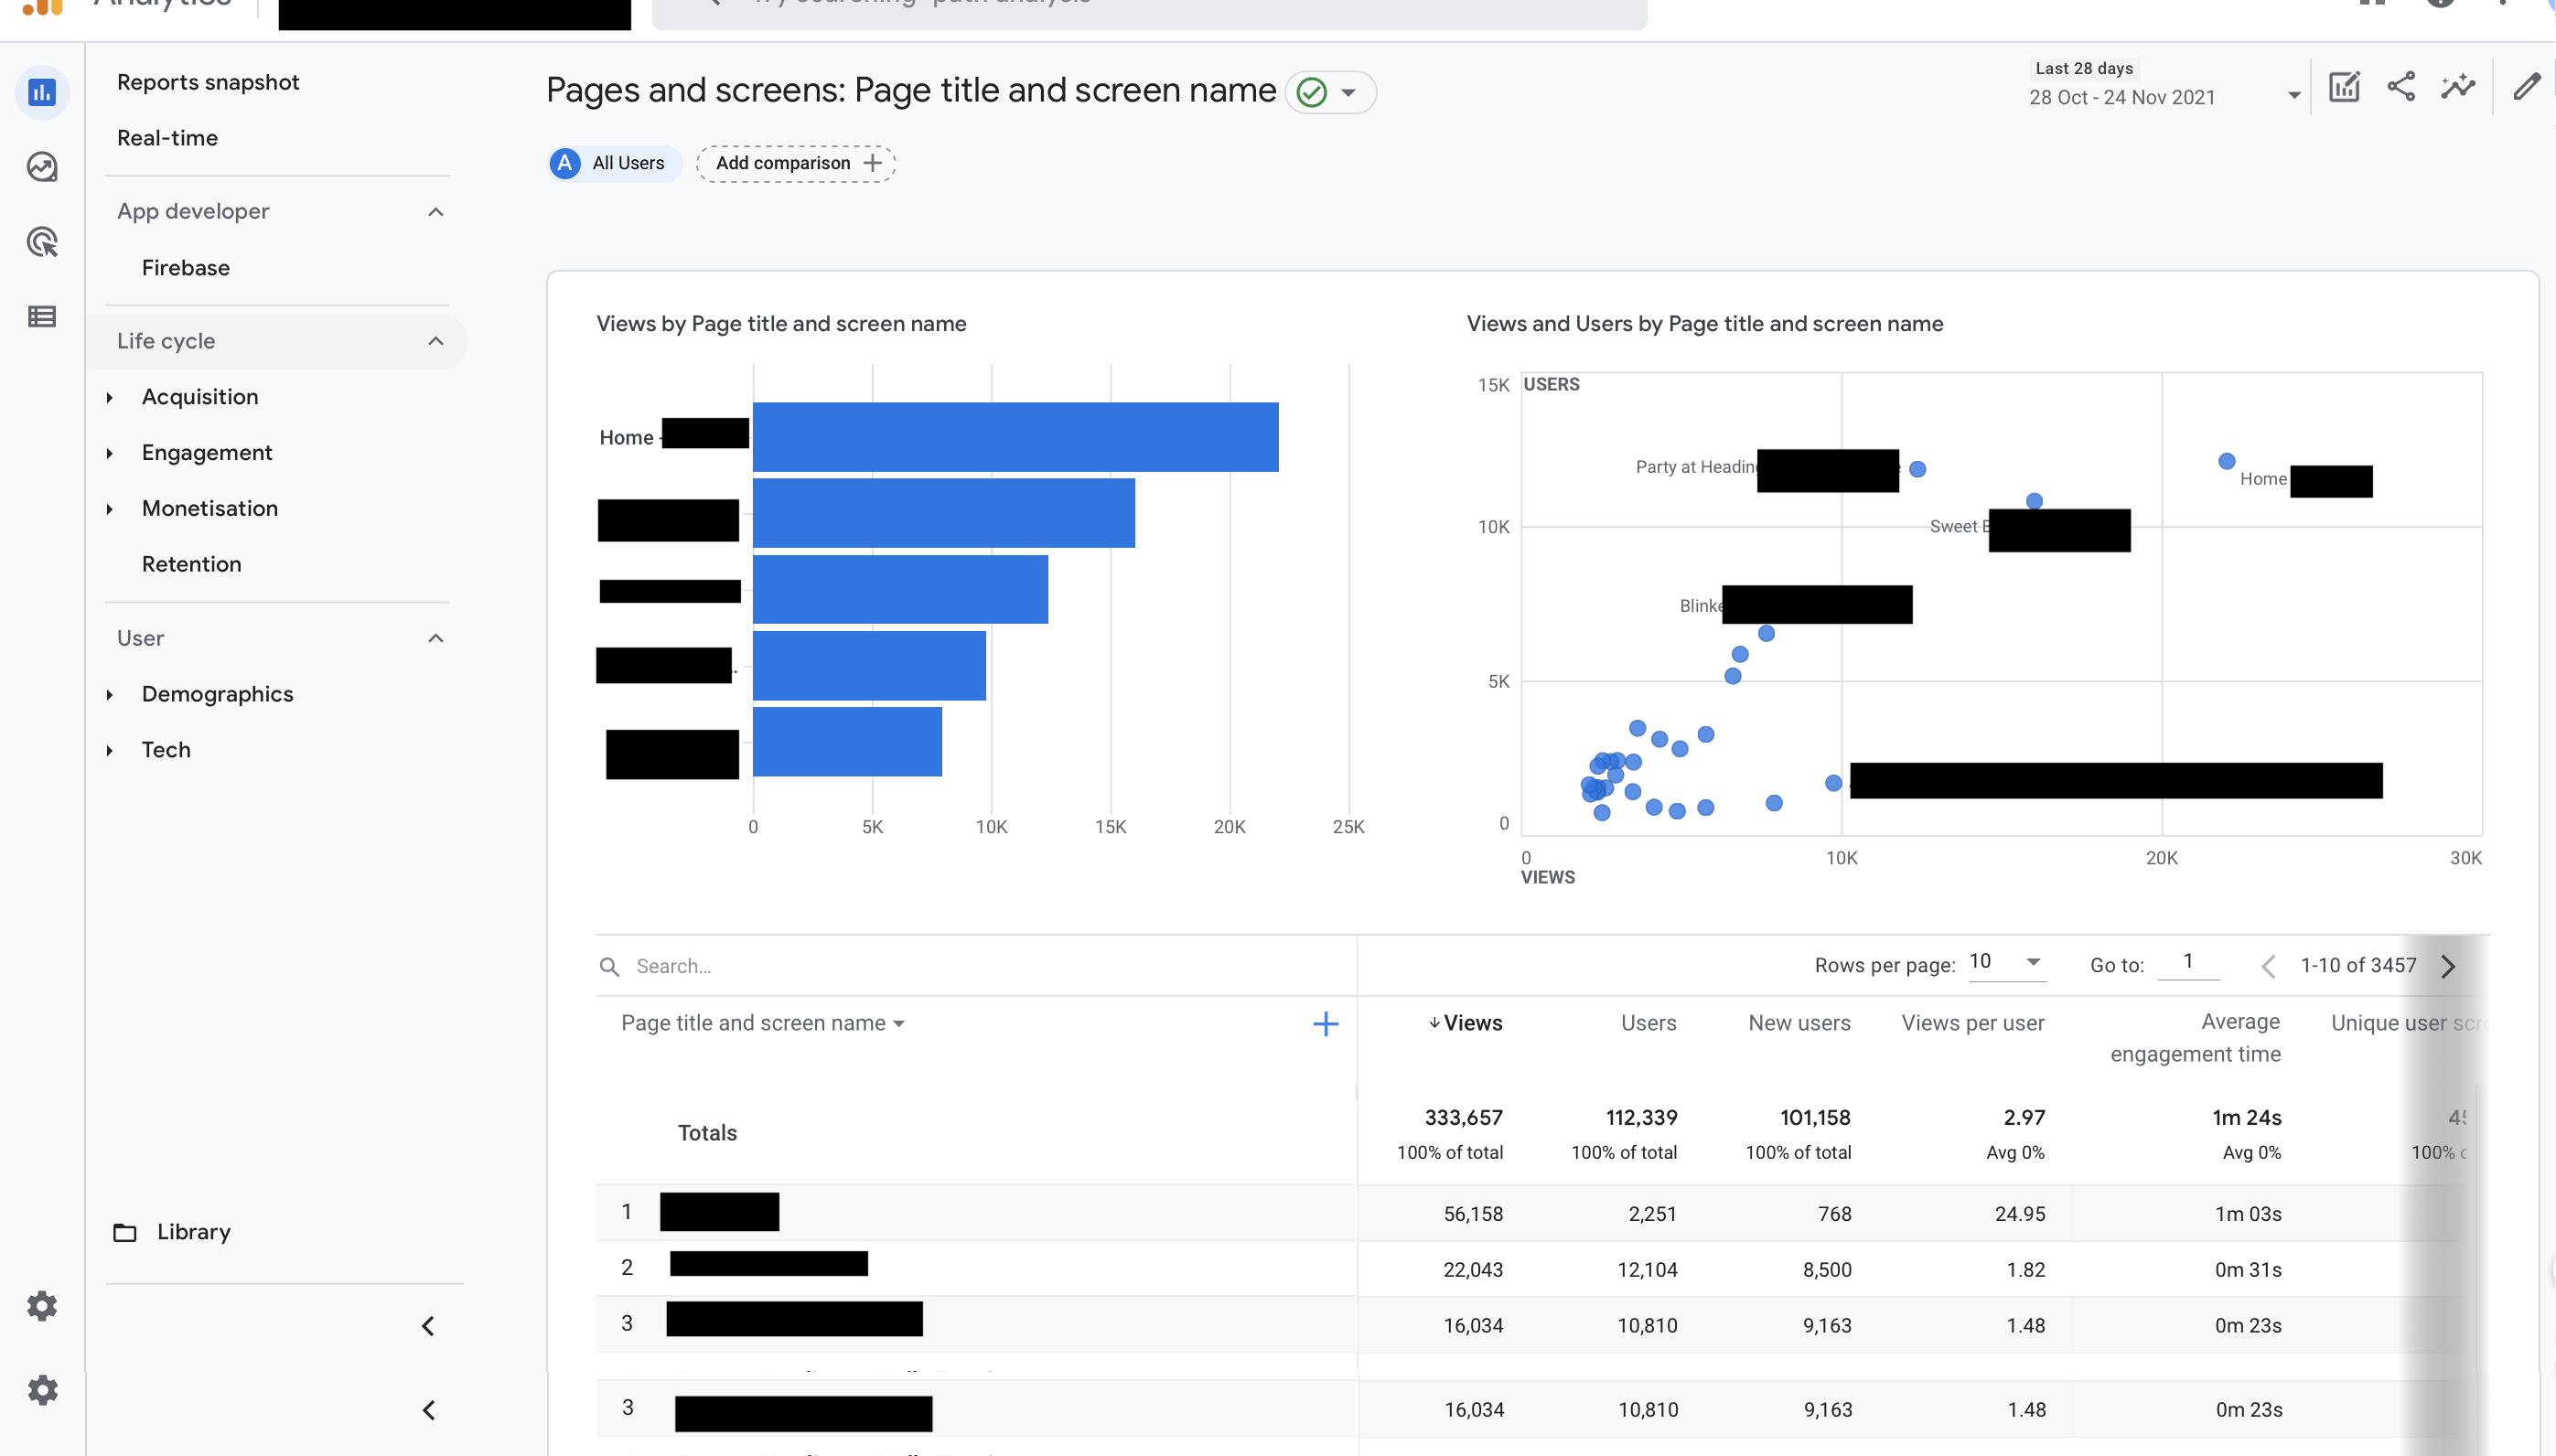
Most popular screens
To identify the most popular screens in your app you'll need to utilise some of our custom dimensions. This is because names in Bolt are derived from differing sources, namely the app code itself for certain screens, the CMS for Timeline and editions, and your content feed for article pages. Below is a quick reference for which dimensions apply to which screens.
| Screen Type | KGPageName | KGEditionName | Screen Name |
| App screens (Onboarding, settings, sign in, subscribe etc) | No | No | Yes, as described in the spec |
| Articles or other content | Yes | Yes | No |
| Editions or timelines | No | Yes | No |
Page Types
The KGPageType dimension will tell you what type of content a page was, the most common being article, but advert, video, audio will all be separate out as their own content type. Note that custom page types added as part of project work may influence these values, most commonly to [Customer Name]Article/Audio/Video etc.
Engagement events
There are several events that can be used to identify the most popular articles [KGPageName], editions [KGEditionName] and tabs. All these events can be found under Engagement / Events and then for each event you will find the metrics for the custom dimensions.
| Custom Dimension | Report Type | Event Name |
|---|---|---|
| Article [KGPageName] | Most Shared | BoltShare |
| Article [KGPageName] | Most Saved | BoltSave |
| Editions [KGEditionName] | Most Screenviews | screen_view |
| Editions [KGEditionName] | Most Screenviews | screen_view |
| Tabs | Most Tapped | BoltTabTapped |
Acquisition
GA4 has a whole tab dedicated to acquisition, which should show you every source that users have installed your app from. Note that in many cases additional work will need to be carried out by your marketing teams to pass the necessary information to the app. This will vary by source (i.e Facebook vs Google vs the App Store)
Most shared
- Most popular tabs: Reports / Engagement / Events / “BoltTabTapped”
- Timelines [Reports / Engagement / Events / Pages and Screens / Change to Page Title and screen name / and filter out “/t/”]
- Audio [Reports / Engagement / Events / “BoltTabTapped”]
- Videos [Reports / Engagement / Events / “BoltVideoPlay”]
-
How many users:
- Read x many articles
- Watch videos
- Listen to audio
- Open push notifications [Reports / Engagement / Events / “notification_open”]
- Which notifications were tapped on the most
Useful Links
Definitions and FAQ's for Pugpig and Google
[GA4] Find your way around Analytics
Pugpig Bolt Analytics Starter Guide
FAQ's
Q. Why do I see (not set) values?
A. This is an issue with firebase itself, whereby all dimensions are recorded for all events. However, certain dimensions don't/can't apply to these events. For example, KGOrientation doesn't apply to BoltAudioFinishedPlaying but will still send as (not set). You can safely ignore these when viewing your reports.
Q. How to check if a custom dimension has been added?
A. [GA4] Custom dimensions and metrics